Update on water quality in the North Fork Kings GSA, consultant reviews the data
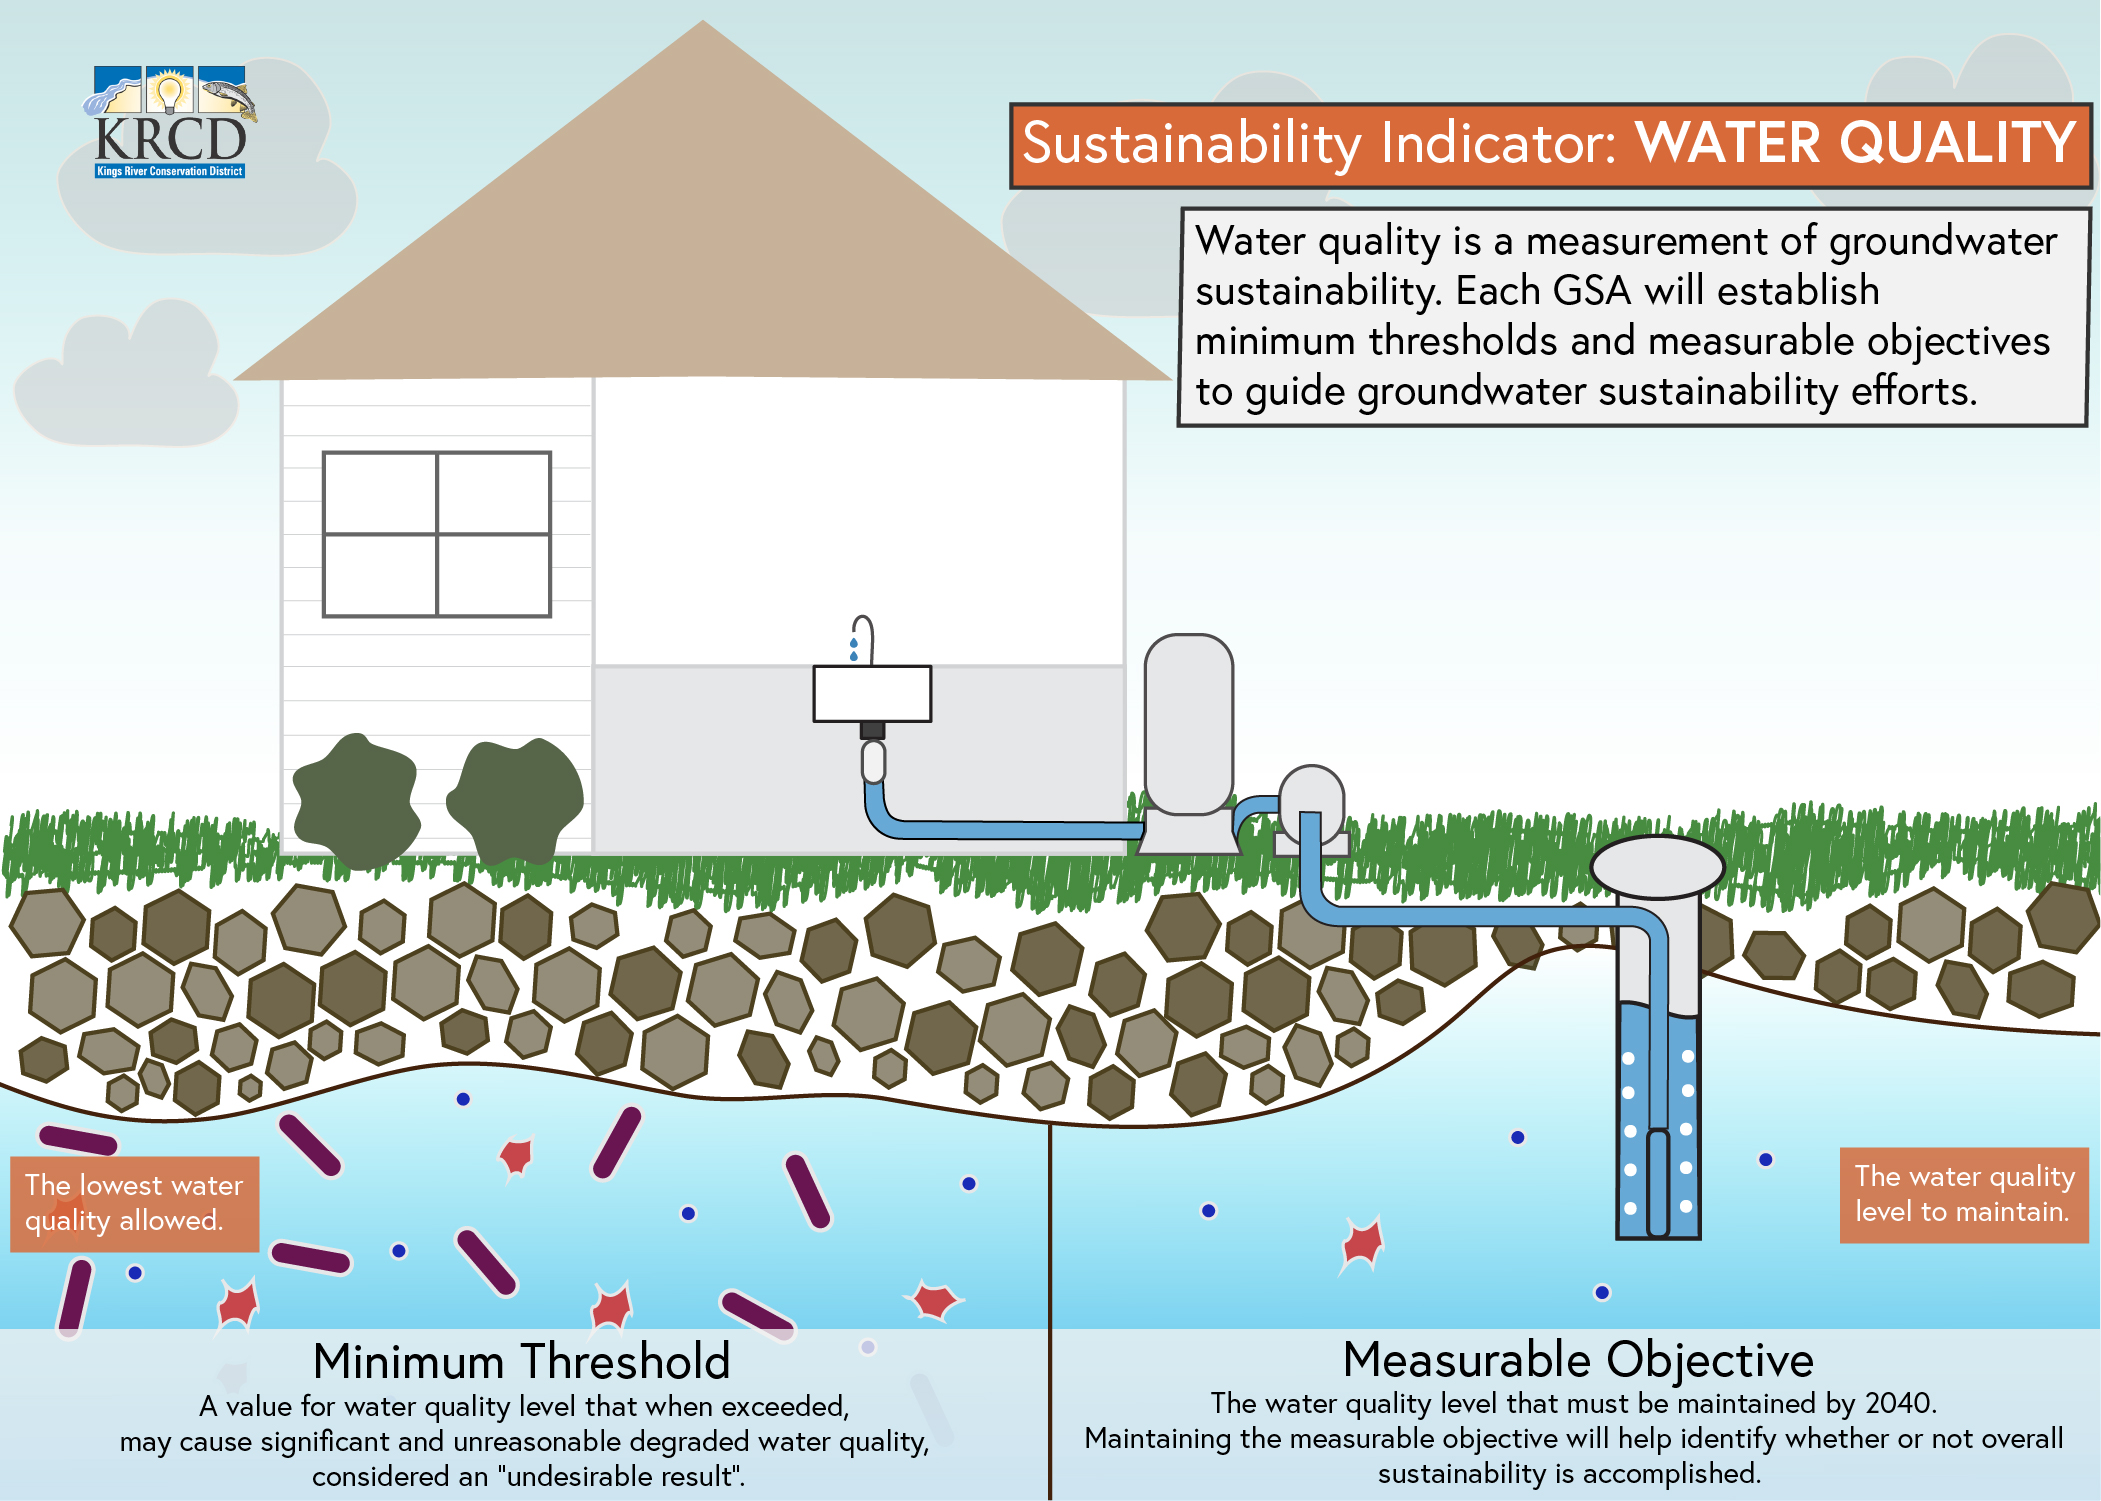
The latest Groundwater Sustainability Plan (GSP) update from the North Fork Kings GSA technical consultants lends insight into the current water quality condition in the GSA service area. Water quality is an indicator of groundwater sustainability. The North Fork Kings GSA will establish sustainability criteria for water quality in its GSP, defining the level of water quality that must be maintained by 2040.
The analysis of water quality data reveals despite lowering groundwater levels, water quality contaminant levels have not worsened over time. But exceedances in maximum contaminant levels (MCL’s) do exist in some areas.
The GSA’s consultant conducted an analysis of publicly available Groundwater Ambient Monitoring and Assessment Program (GAMA) data from 73 wells located in the GSA. This analysis focused on the most recent 10-year period, with some earlier historical data included when available. The black circles on the map below indicate wells with water quality data used in the analysis.
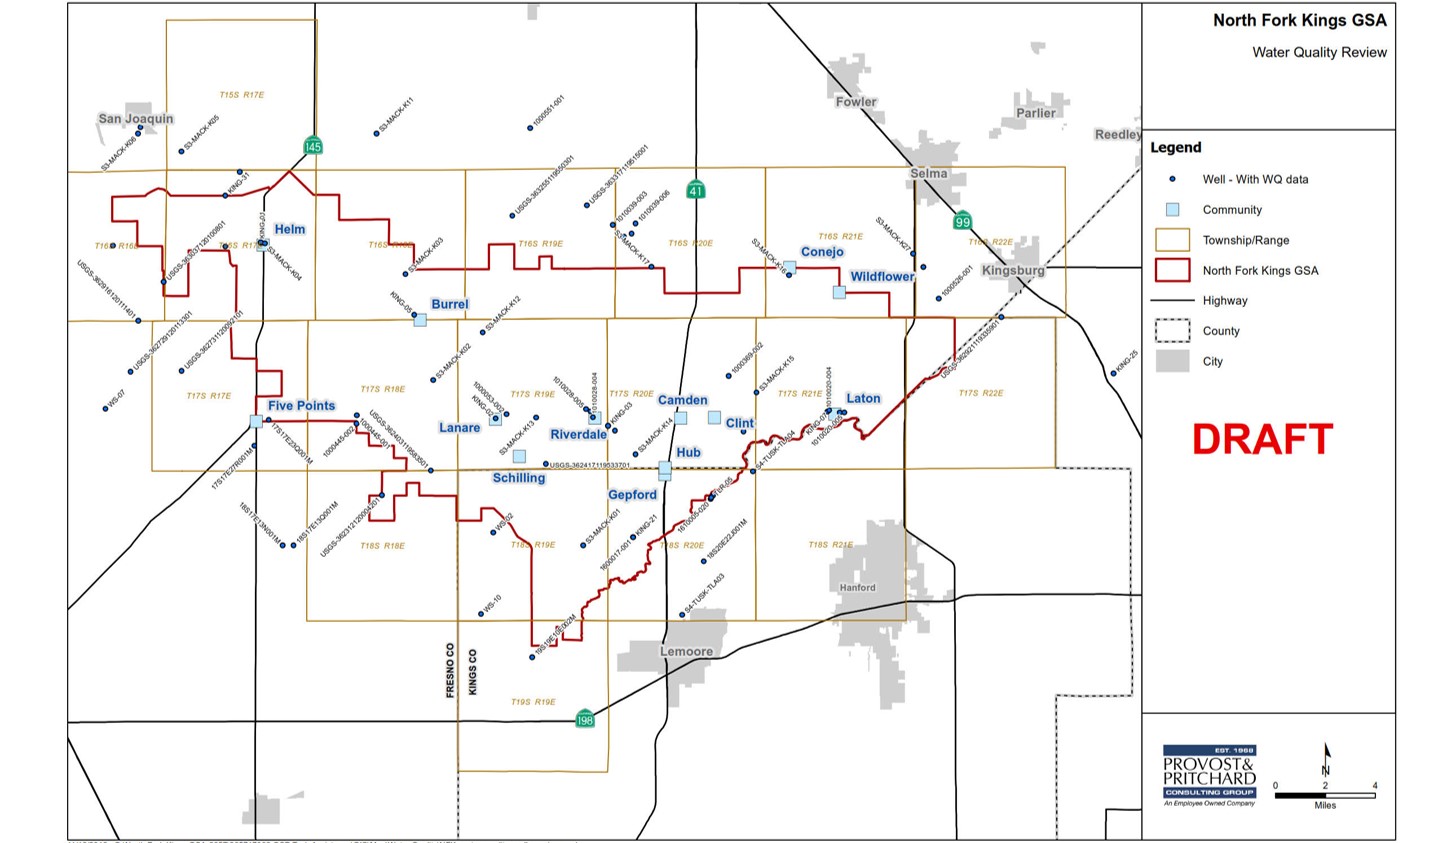
(click to enlarge)
The water quality data drawn from the wells in the North Fork Kings GSA was measured against the Environmental Protection Agency’s (EPA) primary maximum contaminant levels (MCL’s) and secondary MCL’s. Contaminants without MCL’s were measured against health-based screening levels.
EPA’s primary MCL: legally enforceable standards that apply to public water system and protect public health by limiting levels of contaminants in drinking water
EPA’s secondary MCL: non-enforceable guidelines regulating contaminants that may cause cosmetic effects or aesthetic effects. This is the EPA’s recommended standard, but is not required
The water quality data can be analyzed two ways: by contaminants’ level of exceedance (Table 1) or by existence of contaminants in aquifer “zones” (Table 2).
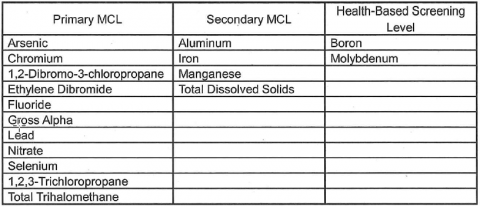
contaimants’ level of exceedance
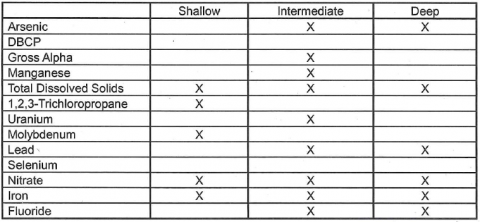
contaminant existence by zone
Existing clay layers in the North Fork Kings GSA allow the division of three conceptual aquifer “zones”: 1) the shallow zone exists from 0-150 feet below ground surface, 2) the intermediate zone exists from 150 feet below ground surface to the base of the unconfined aquifer, and 3) the deep zone exists below the unconfined aquifer. Table 2 above shows that there is not necessarily one zone with water quality exceedances more problematic than another.
Each contaminant’s existing levels can be analyzed individually using separate maps for each aquifer zone. The maps indicate contaminant levels with green, yellow, and red markers. Green indicates contaminant levels are less than half of the MCL. Yellow indicates contaminant levels are more than half or approaching the MCL. Red indicates contaminates are in exceedance of the MCL.
Case Example: Arsenic

Click images to enlarge.
The maps show that there are more arsenic MCL exceedances in the intermediate zone, with exceedances concentrated near the center of GSA.
Case Example: Nitrates

Click images to enlarge.
The nitrate maps indicate few MCL exceedances in the shallow zone, only a couple in the intermediate, and a single instance in the deep zone.
Understanding water quality in the GSA through data analysis is a key step toward setting metrics that guide the North Fork Kings GSA sustainability efforts and indicate success. Water quality is a sustainability indicator; the GSA will establish a measurable objectives for water quality that quantify the level to maintain by the year 2040.